Interactive Dashboard for Itch Creators
A downloadable dashboard for Windows
Description
This Excel-based dashboard is designed to help itch creators visualize and manage their payments and payouts.
A set of easy-to-use charts, indicators, timeline and filters that can provide insights on aspects the itch dashboard doesn't necessarily take into account:
- On which days of the week do people typically purchase my projects?
- How does my gross revenue break down by country?
- Which project contributed the most to my earnings last year?
- How much have I sold last quarter?
It's also a nice record-keeping tool in case you want to keep track of your business on itch.
Features
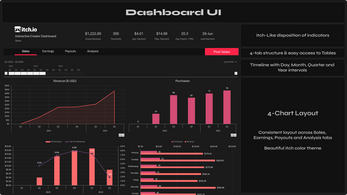
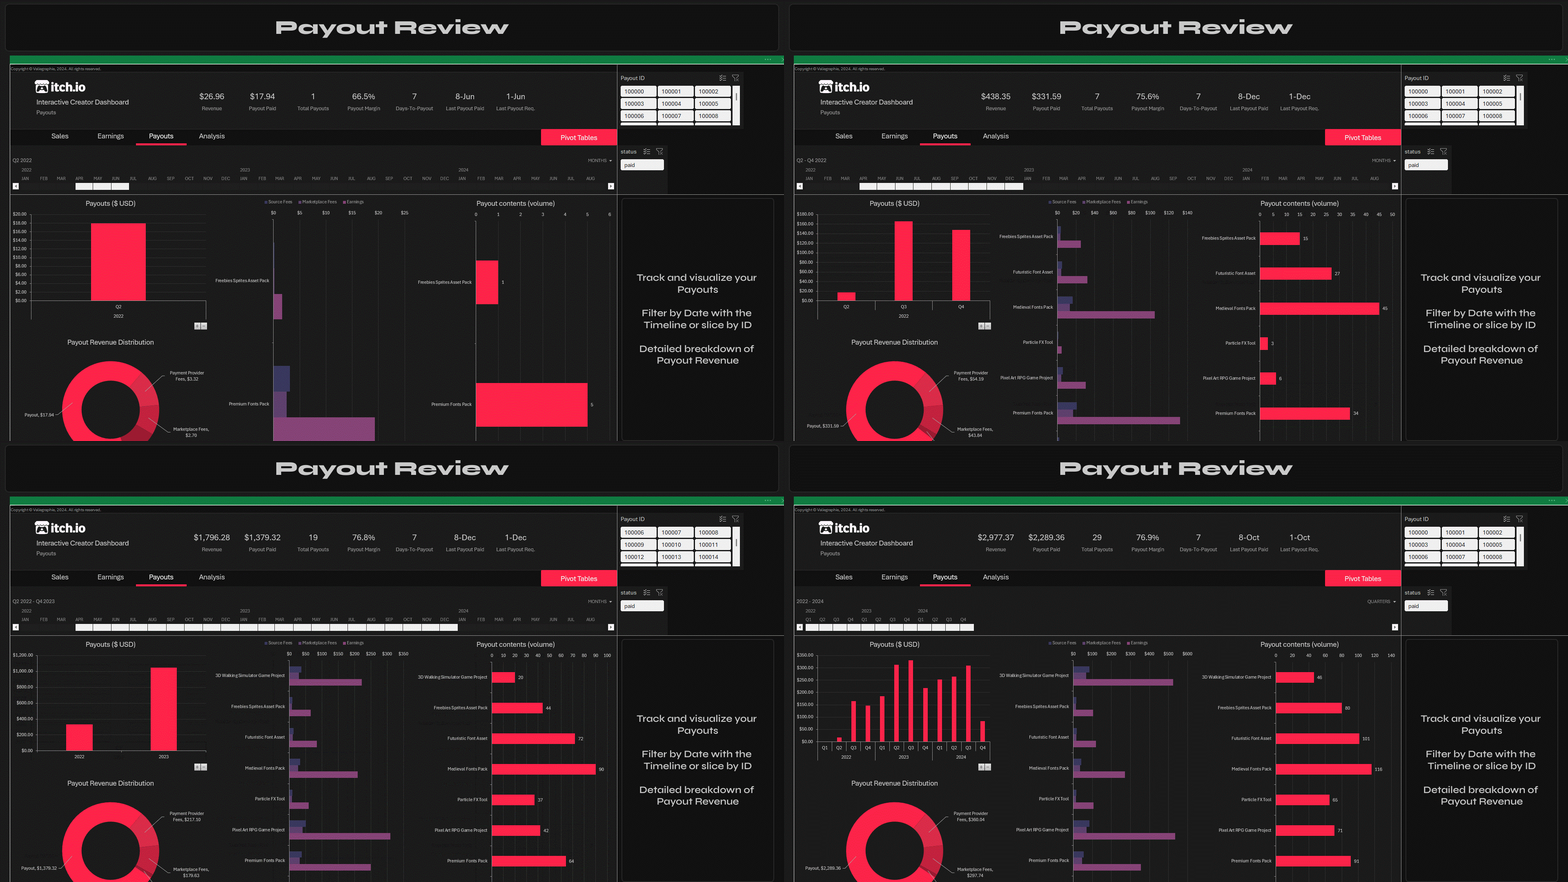
- 4 tabs: Sales, Earnings, Payouts and Analysis
- Each tab follows a 4-chart layout, along with:
- A stats header with some indicators identical to your itch dashboard, and some new
- A timeline to get more granular data and set custom time periods.
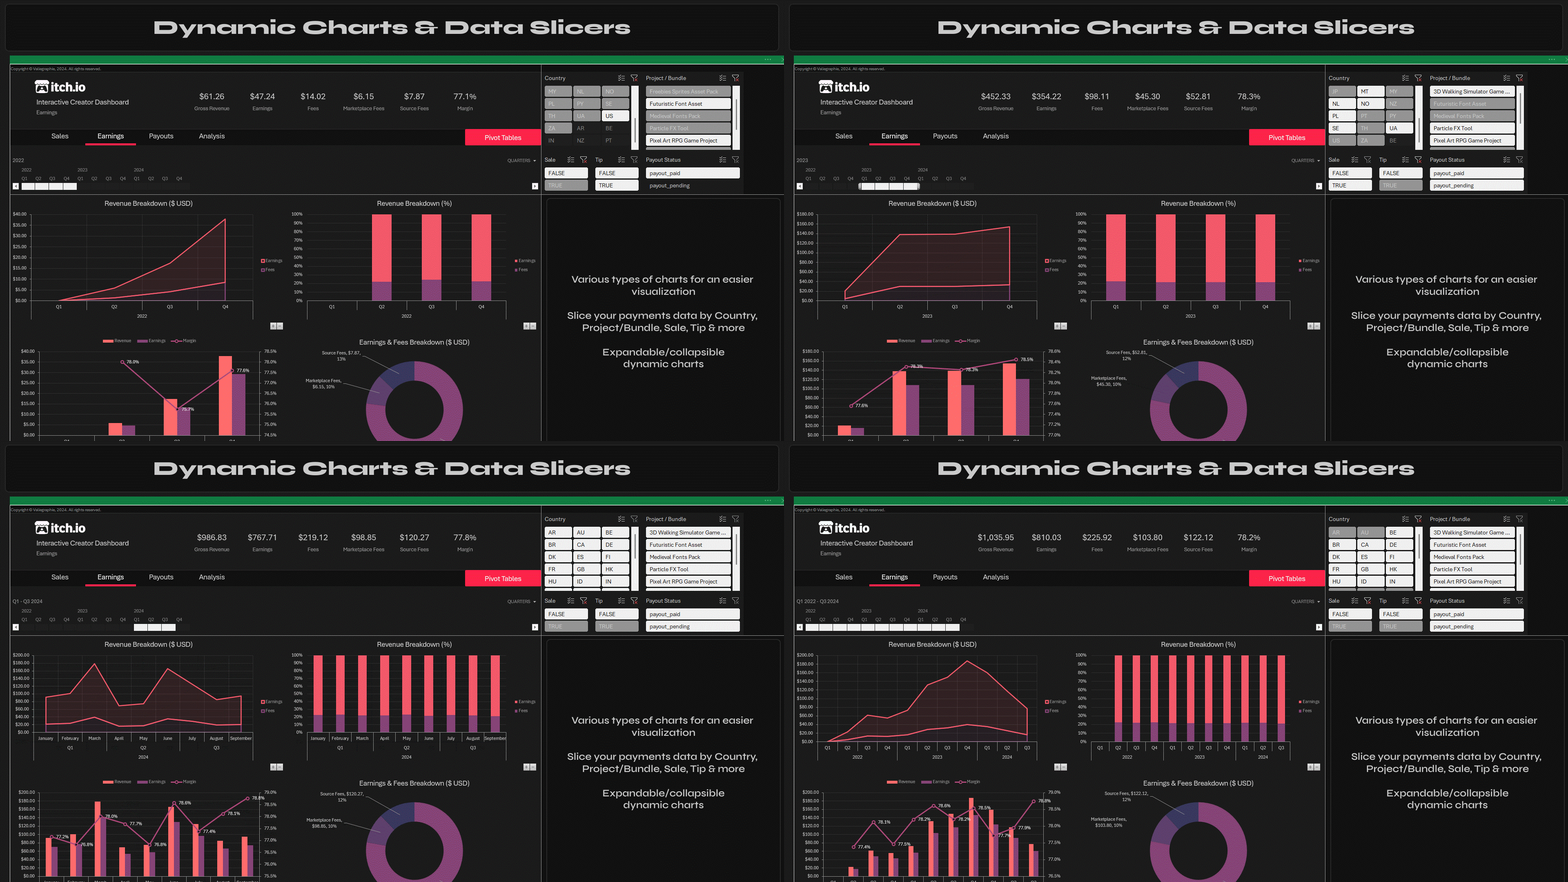
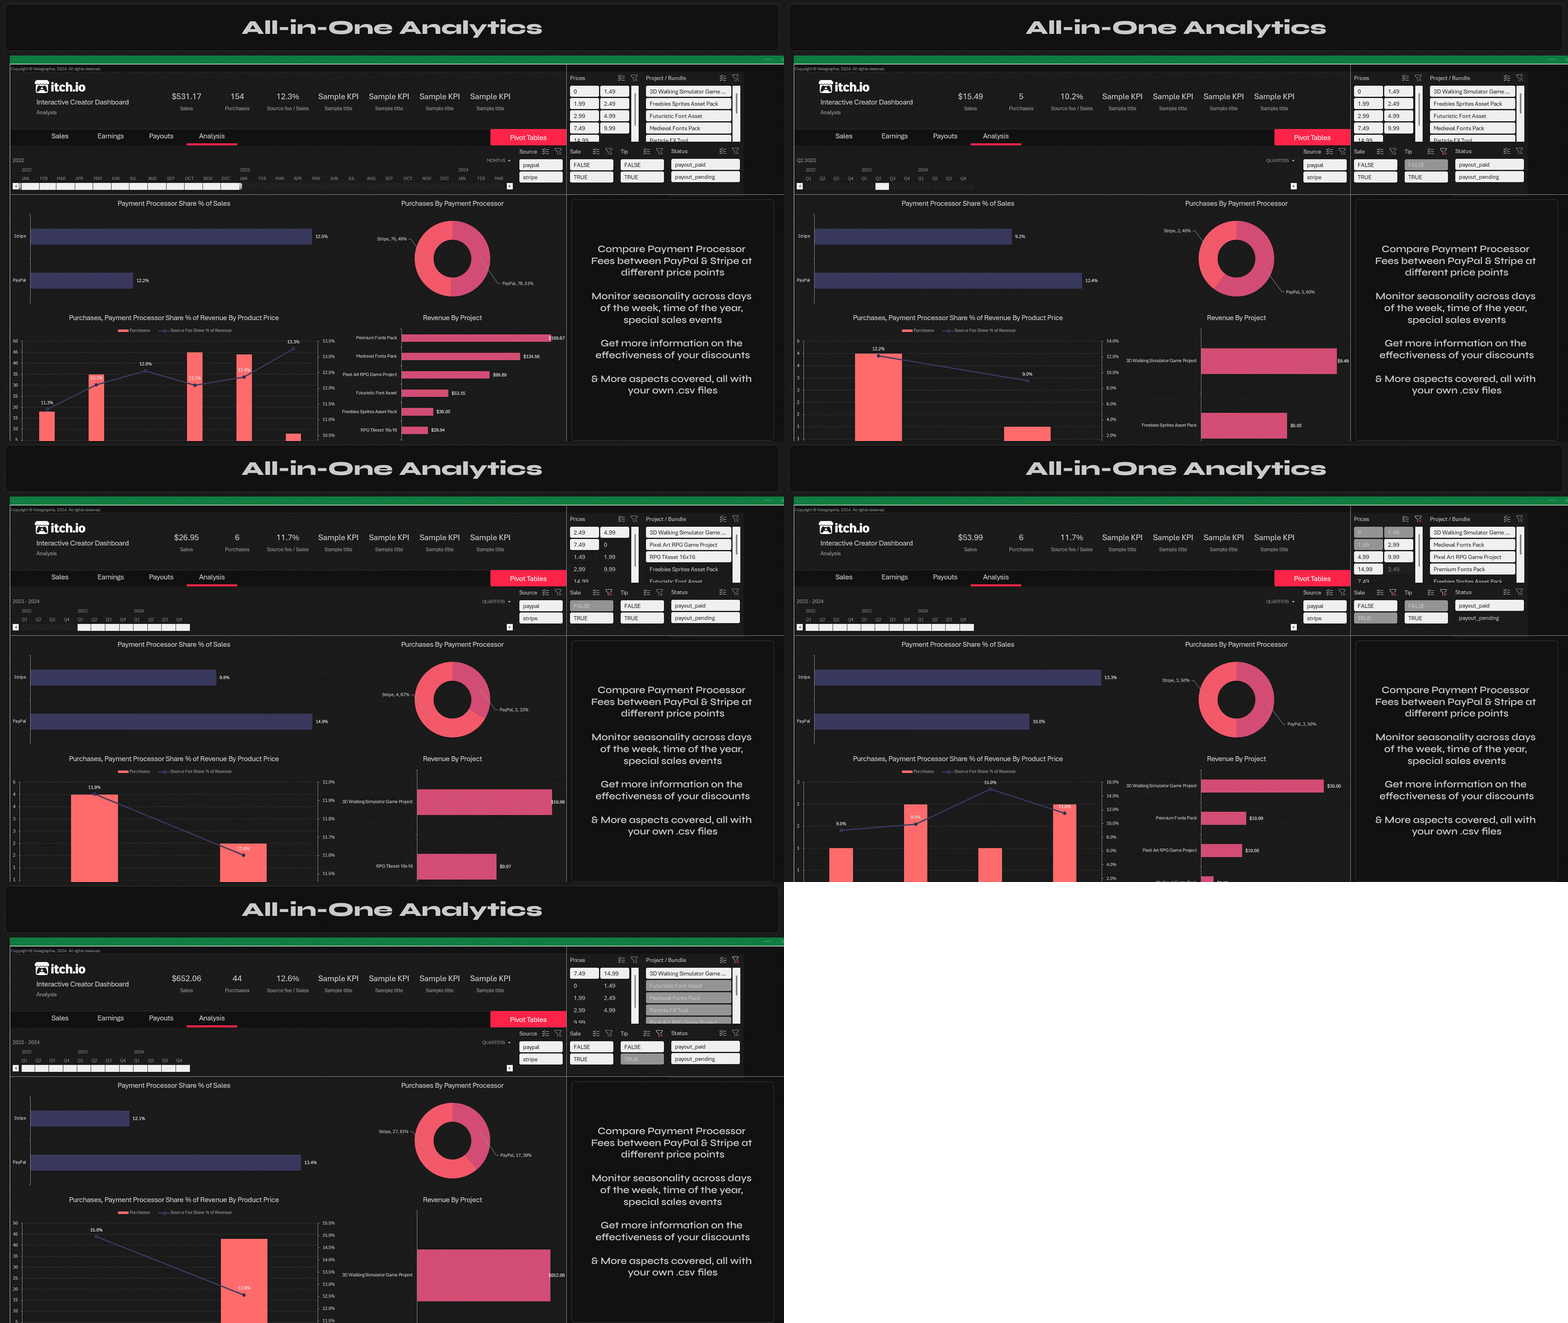
- Filters to explore your data through different angles: Country, Project, Payment Processor, Payout status, Price point, Tip & more
Explore your sales by country, find which days of the week are the busiest or which payment processor takes the biggest share of your revenue at different price points.
Slice your projects and payouts further to get specific figures about tips, project revenue distribution and margin.
Regular updates
To make sure that your dashboard data remains up-to-date, download and import your CSV data regularly (for example after each paid payout, or on a weekly/monthly basis).
Disclaimer
This project is still in development and I am looking for feedback on all aspects. Should you notice errors or miscalculations, please report them in the comments section.
| What this project is ✅ | What this project is not ❌ | |
|---|---|---|
| Type | An Excel file to analyze your itch business CSV data | A software or an application |
| Focus | A dashboard focused on Payments and Payouts analytics | A financial accounting, tax, or web analytics tool |
| Purpose | Built to keep track, measure and give insights on your past activity | A project revolving around business predictions or a forecasting tool |
| Design | Built with a data model to display CSV data in pivot tables/charts quickly and easily | A full-fledged SQL-type database (though you can connect this dashboard to one if you want) |
| For who? | Made for people who create and sell games, assets, tools and other stuff on itch.io | Suitable for marketplaces other than itch.io |
Privacy
All the data you input into this dashboard stays on your local machine. The dashboard operates entirely offline. No information is shared or sold to third parties in any shape or form; this would breach itch.io's privacy policy.
This dashboard does not make use of the personal information of your customers. This tool is designed solely to help you organize, visualize and analyze on your own sales records offline and locally.
Requirements
The dashboard is configured for payments and payouts data in USD. If you've opted for the itch Payout model, everything should work fine. I can't guarantee this dashboard will be of any use if you opted for the "Direct to you" model as I never tried it.
To use this dashboard with its full features, you’ll need Excel 2016 or later on Windows, as it requires both Power Query and Power Pivot¹ for full functionality.
¹ Power Query and Power Pivot being proprietary technologies of Microsoft, this project will not run properly in a LibreOffice environment or with Google Sheets. This project is not compatible with Excel on Mac or Excel Online, as these Excel versions currently do not support Power Query or Power Pivot.
Project contents
- Dashboard.xlsx file
- PDF Setup guide, with instructions on how to set up and use the dashboard
- Sample data (purchases.csv, payouts.csv and item-revenues.csv in their respective subfolders) for demo purposes, before you feed it with your own csv files
Features Progress
| Feature | Description | Status |
|---|---|---|
| Interface | ||
| Navigation Bar | Intuitive navigation bar for quick access to different dashboard sections and underlying tables | ✅ |
| Indicators Bar | Dynamic indicators for a quick overview | ✅ |
| 4-Tab / 4-Chart Layout | Optimized structure and layout with 4 tabs and 4 charts per tab | ✅ |
| Itchy Theme and Color Palette | itch-like Color palette and theme for a simple and familiar interface | ✅ |
| Data | ||
| CSV Data Import | Automated CSV data import using Power Query | ✅ |
| PowerPivot Data Model | Data model organizing quantitative and qualitative data | ✅ |
| Analysis | ||
| Multi-Level Time Analysis (Yearly, Quarterly, Monthly, Daily) | Simplifies analyses at various levels of granularity | ✅ |
| Slicers for Advanced Filtering | Advanced filters allowing specific analyses by project, country, price, etc. | ✅ |
| Status | Released |
| Category | Tool |
| Platforms | Windows |
| Author | Valiegraphie |
| Tags | analysis, dashboard, excel, insights, manager, spreadsheet |
Download
Click download now to get access to the following files:
Development log
- Dashboard v.1.1 UpdateDec 23, 2024


Comments
Log in with itch.io to leave a comment.
Ok anyway can you please try my game Skyline Master 2 it's in the alpha stage but it's pretty decent its free on Windows, Mac and Android.
Can u please make a version for macos
Unfortunately I still can’t as Excel for Mac doesn’t support Power Pivot :/